How should we measure the success of our schools? How do tax payers know what return they’re getting on their investment? These are fair questions to ask.
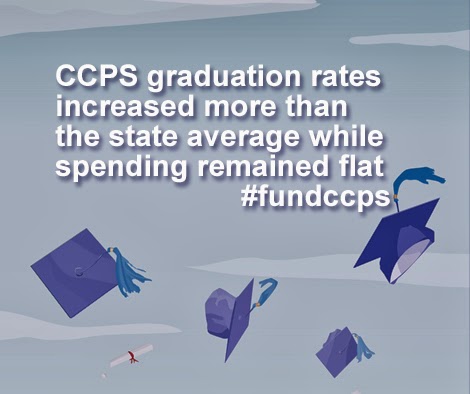
According to data published in the CCPS Board of Education Budget Request for FY 2015, the graduation rates in Cecil County have increased at a rate greater than the state average in nearly all categories. And it’s important to note that these increases happened during a time when CCPS spending was essentially flat.
Four‐Year Cohort Graduation Rate (2010‐2013)
- State ‐ 81.97% to 84.97% (3.00% increase)
- CCPS ‐ 80.46% to 86.69% (6.23% increase)
Five‐Year Cohort Graduation Rate (2010‐2012)
- State ‐ 84.57% to 86.32% (1.75% increase)
- CCPS ‐ 82.97% to 86.19% (3.22% increase)
Graduation Rate for Special Education (2010‐2013)
- State ‐ 54.72% to 60.03% (5.31% increase)
- CCPS ‐ 38.52% to 51.26% (12.74% increase)
Graduation Rate for FaRMS (2010‐2013)
- State ‐ 73.70% to 75.81% (2.11% increase)
- CCPS ‐ 80.13% to 79.40% (0.73% decrease)
Graduation Rate for African American Students (Class of 2010 vs. Class of 2013)
- State ‐ 74.02% to 78.26 % (4.24% increase)
- CCPS ‐ 76.81% to 84.72% (7.91% increase)
Graduation Rate for Hispanic/Latino Students (Class of 2010 vs. Class of 2013)
- State ‐ 73.44% to 75.08% (1.64% increase)
- CCPS ‐ 74.47% to 82.76% (8.29% increase)
Graduation Rate for Boys (Class of 2010 vs. Class of 2013)
- State ‐ 78.32% to 81.64% (3.32% increase)
- CCPS ‐ 76.83% to 83.71% (6.88% increase)
Graduation Rate for Girls (Class of 2010 vs. Class of 2013)
- State ‐ 85.75% to 88.38% (2.63% increase)
- CCPS ‐ 84.08% to 89.98% (5.90% increase)
You can read more statistics about Cecil County graduation rates on the Maryland Report Card web site.
What Can You Do?
Contact the County Executive and members of the County Council and encourage them to support the CCPS budget.
- Tari Moore–County Executive–[email protected]
- Alan McCarthy–Vice President–[email protected]
- Joyce Bowlsbey–[email protected]
- Michael Dunn–[email protected]
- Diana Broomell–[email protected]
- Robert Hodge–President–[email protected]
